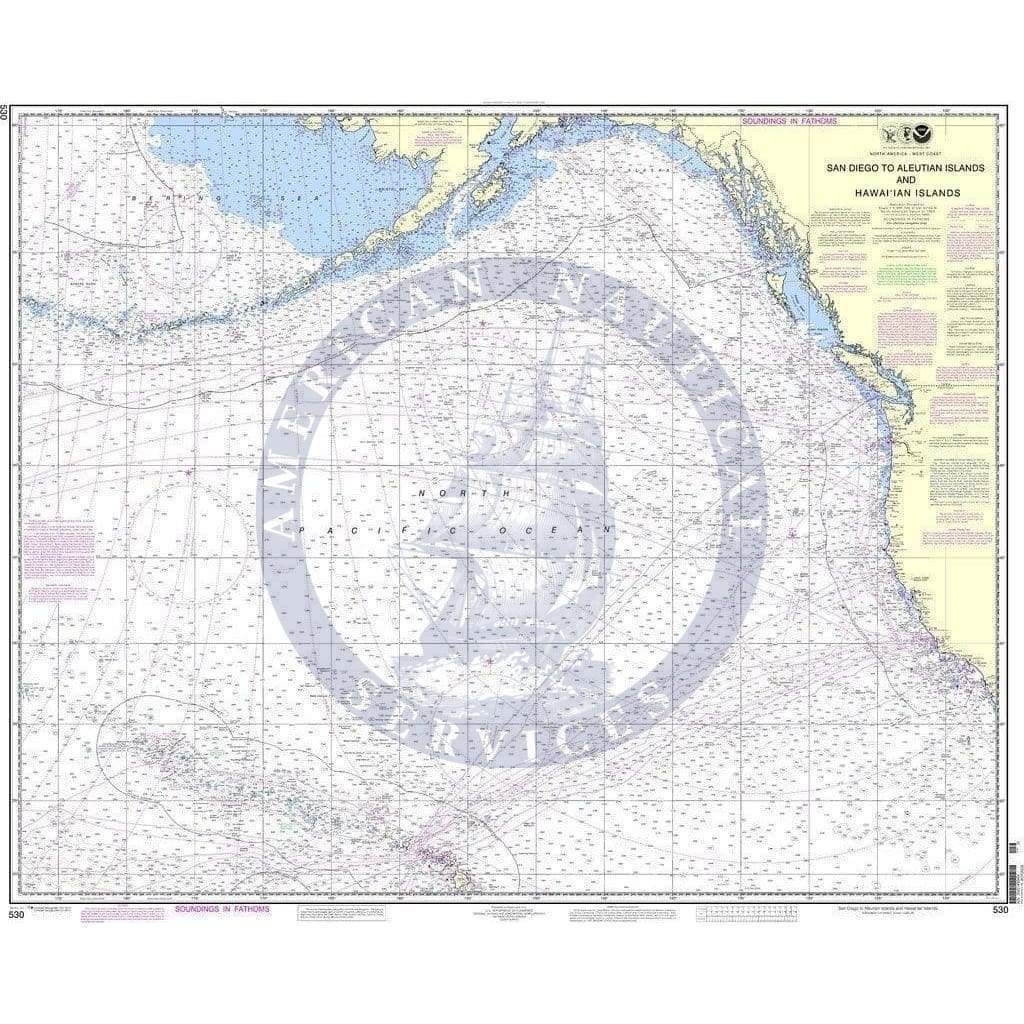
Hurricane Tracking Chart: East Pacific
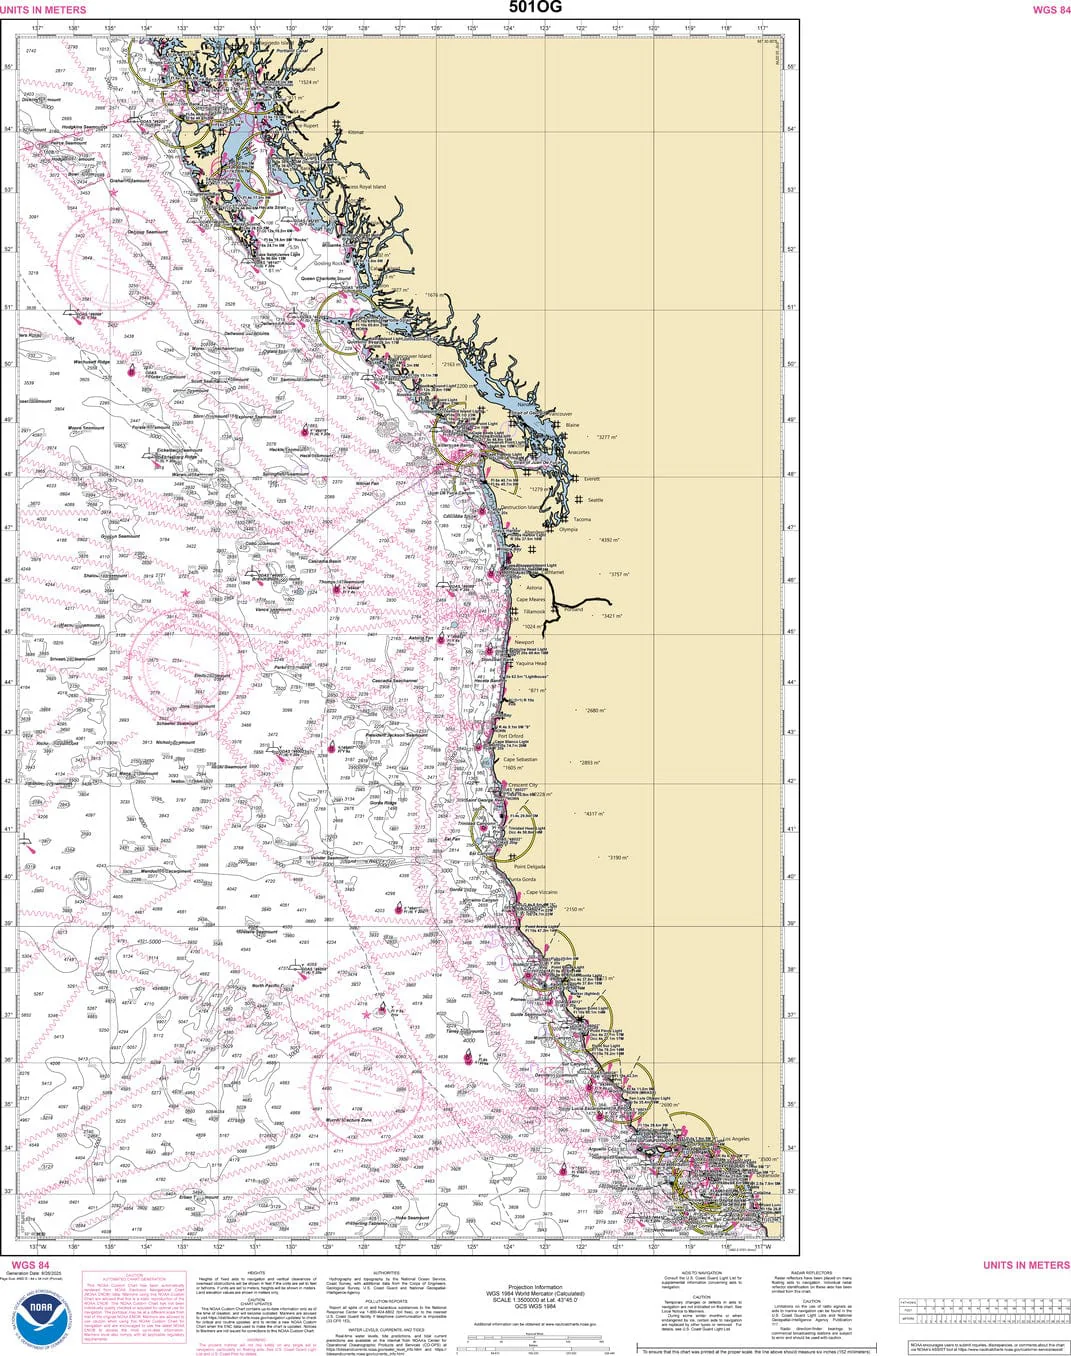
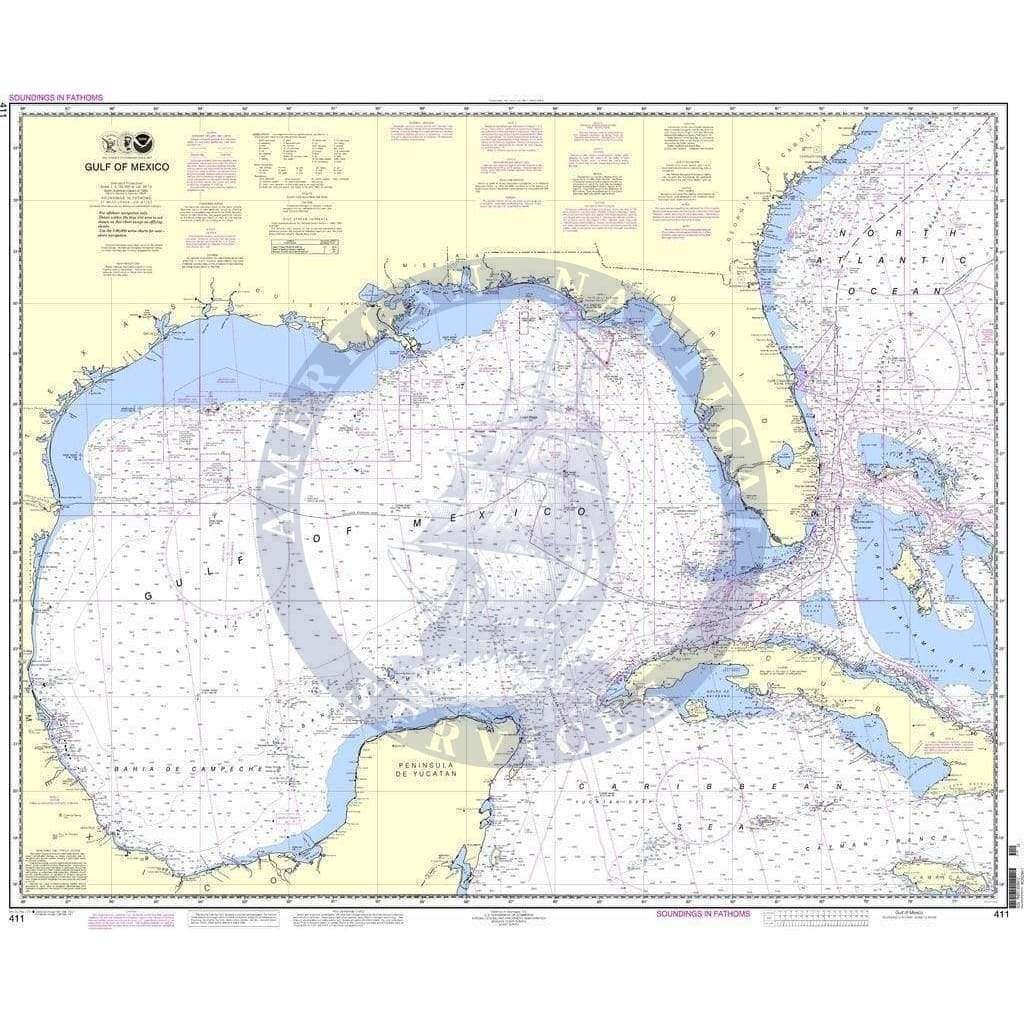
The chart you are viewing is a hurricane tracking chart. It allows arm-chair storm chasers and nautical enthusiasts to track and record storm progress throughout the hurricane season. The official hurricane season for the east pacific runs from May 15th to November 30th.
While the effects of inland hurricane activities are well documented, the impact hurricanes have on the coast line and waterways can be as devastating. In 2005, Hurricane Katrina accounted for as many as 300 obstructions to navigation as charted by NOAA.
Paper Size: 35.0" x 24.0"
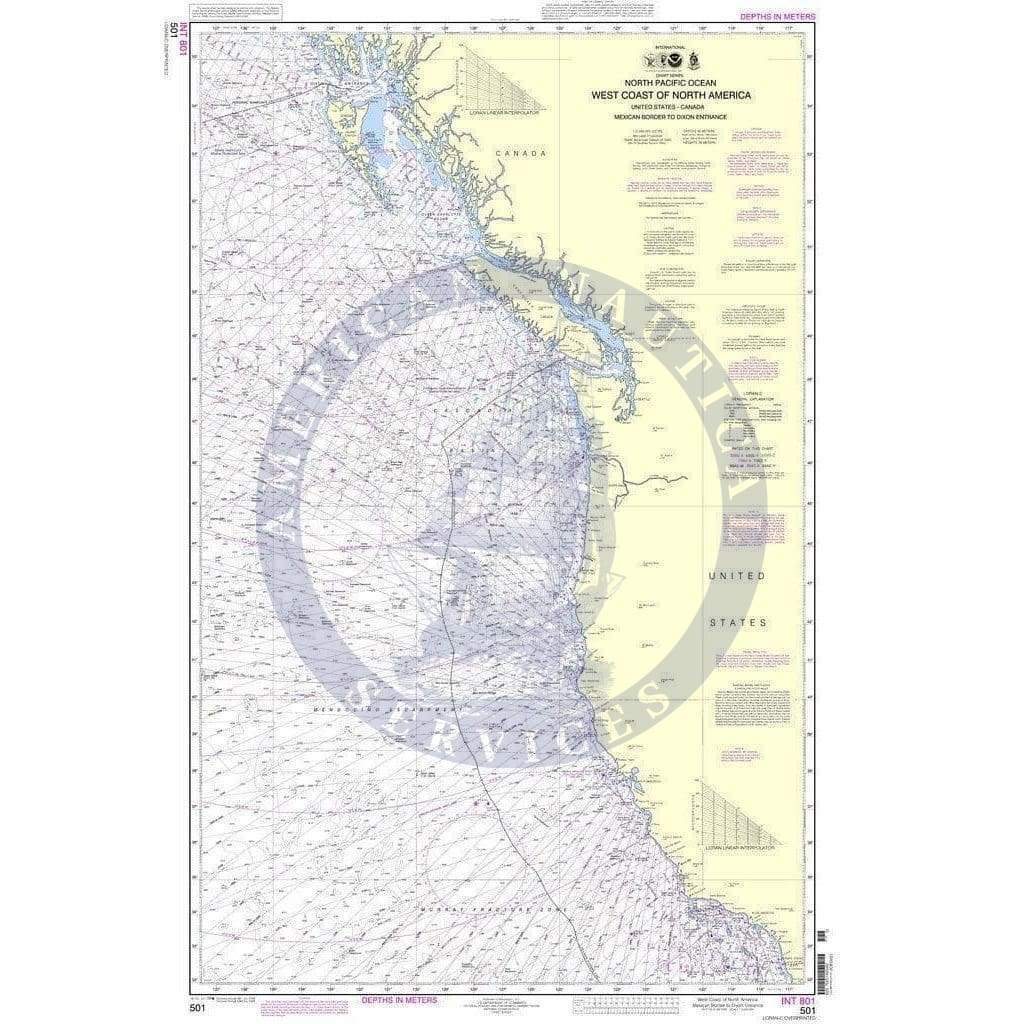
Original : $2,200.00
-70%$2,200.00
$660.00Description
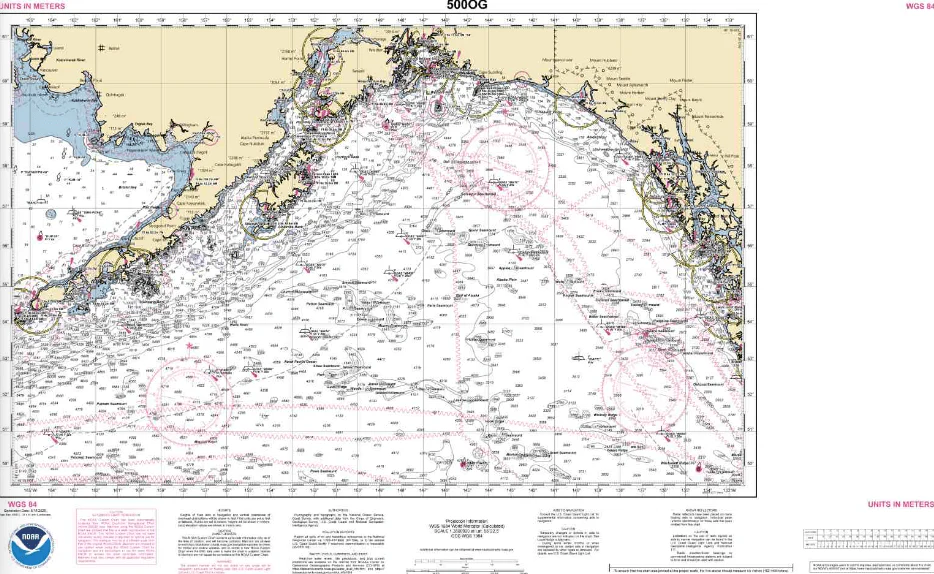
The chart you are viewing is a hurricane tracking chart. It allows arm-chair storm chasers and nautical enthusiasts to track and record storm progress throughout the hurricane season. The official hurricane season for the east pacific runs from May 15th to November 30th.
While the effects of inland hurricane activities are well documented, the impact hurricanes have on the coast line and waterways can be as devastating. In 2005, Hurricane Katrina accounted for as many as 300 obstructions to navigation as charted by NOAA.
Paper Size: 35.0" x 24.0"